Short answer
- To find the midrange of a data set, add the smallest value and the largest value, then divide the sum by 2. The formula is: Midrange = (minimum + maximum) / 2 For example, in the data set 4, 7, 9, 12, 18, 23, the minimum is 4 and the maximum is 23. The midrange is (4 + 23) / 2 = 27 / 2 = 13.5. The rest of this article explains when that answer is helpful, when it can mislead, and how it compares with the mean, median, mode, and range.
What Is the Midrange?
The midrange is a measure of center. It gives one number that sits exactly halfway between the smallest and largest values in a data set. It is sometimes described as a type of average, but that description needs care. The ordinary average, the mean, uses every value. The midrange uses only two values: the minimum and the maximum. Everything in between is ignored by the calculation itself.
That simplicity is both the appeal of the midrange and its main weakness. It is fast and easy to explain, but fragile, because one unusually large or unusually small value can move it a long way. The midrange is also known as the mid-extreme, because it averages the extremes. It should not be confused with the median, the middle value in an ordered list.
The Midrange Formula
Midrange = (minimum value + maximum value) / 2
In symbols, writers often use min for the minimum, max for the maximum, and M for the midrange:
M = (max + min) / 2
The order of addition does not matter. What matters is that the two numbers are the true smallest and largest values in the set, not guesses, and not the first and last numbers in an unsorted list unless those happen to be the extremes. For grouped data, class limits are a separate case, covered later in this article.
A useful check follows from the formula. The midrange must always fall between the minimum and the maximum, inclusive. If your answer falls outside that span, recheck the addition, the division by 2, and the extremes you picked.
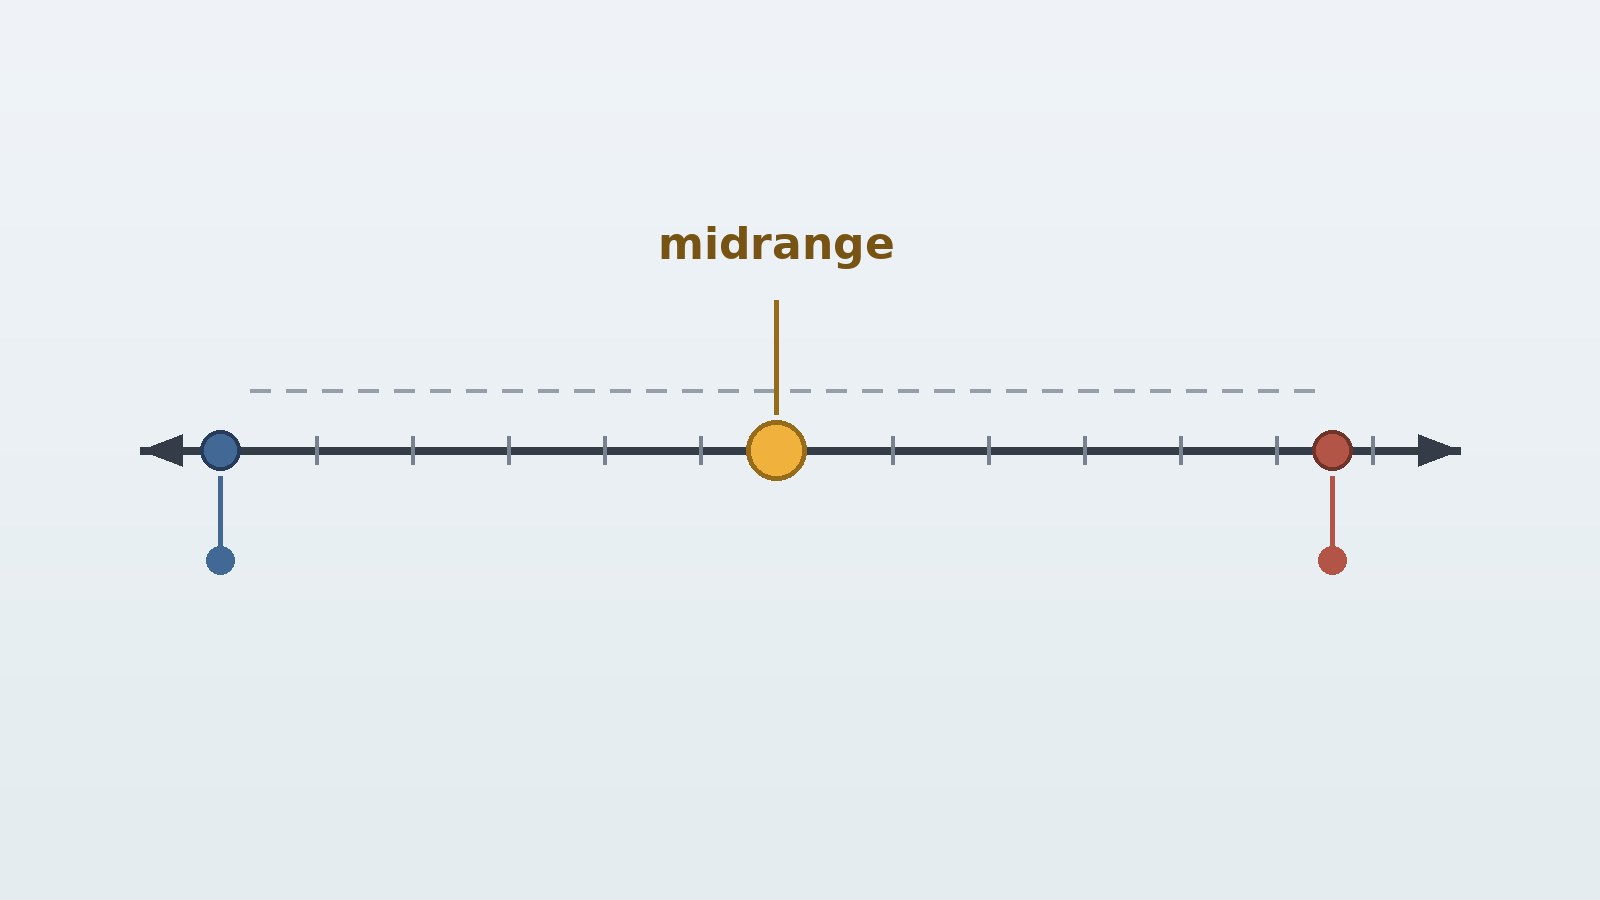
Think of a number line with the minimum at one end and the maximum at the other. The midrange is the point exactly in the middle of that segment. If most values cluster at one end, that middle point may sit far from most of the data.
How to Find Midrange, Step by Step
Follow these four steps in order. Sorting first is not strictly required, since you only need the extremes, but it is the easiest way to avoid picking the wrong numbers, especially in a longer list.
Step 1: Write Out the Data Set
Write the values in one list and count them. Counting helps you spot a missing value or a value copied twice. Keep the units with the numbers, such as dollars or degrees. The midrange will carry the same unit as the data.
Step 2: Order the Values From Smallest to Largest
Arrange the values in ascending order. For a longer list, sort carefully and recount after sorting to make sure no value was dropped or duplicated. Ordering also makes the median and range easier to find later.
Step 3: Identify the Minimum and the Maximum
In the sorted list, the minimum is the first value and the maximum is the last value. Double check both ends. A common error is to mistake the second smallest or second largest value for an extreme, especially when a negative sign is involved: negative 6 is smaller than negative 2. If a data set has only one distinct value repeated, the minimum and the maximum are the same, and the midrange is that value.
Step 4: Add the Extremes and Divide by 2
Add the minimum and the maximum, then divide the sum by 2. Show the arithmetic so a reader or marker can follow each step. If the data are whole numbers and the sum is odd, the midrange will end in .5. That is correct and should not be rounded away without a reason.
Worked examples follow. All example data sets are invented for teaching, not survey results or real measurements.
Worked Examples
Example 1: A Small Whole Number Data Set
Example data set: 18, 4, 12, 23, 7, 9
Step 1: Order the values from smallest to largest: 4, 7, 9, 12, 18, 23.
Step 2: Identify the extremes. The minimum is 4. The maximum is 23.
Step 3: Add the extremes: 4 + 23 = 27.
Step 4: Divide by 2: 27 / 2 = 13.5.
The midrange is 13.5.
Notice that 13.5 does not appear in the data set. That is normal: the midrange is an average of two values, so it can fall between observed values. Do not force the answer to be a value from the list. For comparison, this set has a mean of 12.17, rounded to two decimal places, a median of 10.5, no mode, and a range of 19, with arithmetic in the comparison section below.
Example 2: Prices in Dollars
Example data set, in dollars: 57, 24, 68, 18, 42, 29, 35
Step 1: Order the values from smallest to largest: 18, 24, 29, 35, 42, 57, 68.
Step 2: Identify the extremes. The minimum is 18 dollars. The maximum is 68 dollars.
Step 3: Add the extremes: 18 + 68 = 86.
Step 4: Divide by 2: 86 / 2 = 43.
The midrange is 43 dollars.
In plain language, 43 dollars is halfway between the cheapest price, 18 dollars, and the most expensive price, 68 dollars. It is not the average price paid, because the mean here is 39 dollars, and it is not the middle price in the ordered list, because the median is 35 dollars.
Example 3: Negative Numbers and Decimals
Example data set: 8, negative 6, 3, 0.5, 14, negative 2
Step 1: Order the values from smallest to largest: negative 6, negative 2, 0.5, 3, 8, 14.
Step 2: Identify the extremes. The minimum is negative 6. The maximum is 14.
Step 3: Add the extremes: negative 6 + 14 = 8.
Step 4: Divide by 2: 8 / 2 = 4.
The midrange is 4.
This example shows why signs matter. If negative 2 were mistaken for the minimum, the midrange would be 6, which is wrong. Sorting first removes that risk. For reference, the mean here is 2.92, rounded to two decimal places, the median is 1.75, and the range is 20.
Example 4: A Temperature Example
Example data set, daily high and low only: high 84 degrees, low 61 degrees
This two value case is the form in which many readers already meet the midrange without knowing its name. Add the high and the low, then divide by 2:
84 + 61 = 145 145 / 2 = 72.5
The midrange is 72.5 degrees.
A commonly cited everyday use is the daily mean temperature in weather summaries, where the reported mean for a day is often the average of that day’s highest and lowest temperatures. That is a midrange calculation, even when the report simply calls it the mean. It is not the same as averaging readings taken through the whole day.
Checking Your Answer With the Range
Take Example 1 again: minimum 4, maximum 23, range 19. Add half the range to the minimum: 4 + (19 / 2) = 4 + 9.5 = 13.5. That matches the midrange, as it must, because (minimum + maximum) / 2 is the same as minimum + (maximum minus minimum) / 2. Half the range on its own, 9.5, is not the midrange. It is only the distance from the minimum up to the midrange.
Midrange vs Mean vs Median vs Mode vs Range
These five terms are easy to mix up under exam pressure. The table below keeps them apart, and the worked comparison uses one data set for all five measures.
| Measure | What it uses | How to find it | What it tells you |
|---|---|---|---|
| Midrange | Only the minimum and maximum | (minimum + maximum) / 2 | The midpoint of the span of the data |
| Mean | Every value | Add all values, divide by the count | The ordinary average, balancing all values |
| Median | The middle position in an ordered list | Middle value, or the average of the two middle values when the count is even | The value that splits the ordered data in half |
| Mode | Frequencies | The value that occurs most often | The most common value, if one exists |
| Range | Only the minimum and maximum | Maximum minus minimum | How spread out the data are, from end to end |
A Single Worked Comparison
Use Example 1 again: 4, 7, 9, 12, 18, 23, already ordered.
Midrange: (4 + 23) / 2 = 27 / 2 = 13.5.
Mean: Add all values: 4 + 7 + 9 + 12 + 18 + 23 = 73. Divide by the count, 6: 73 / 6 = 12.1666, which rounds to 12.17.
Median: With an even count of 6, the median is the average of the two middle values, the third and fourth values: (9 + 12) / 2 = 21 / 2 = 10.5.
Mode: No value repeats, so this example set has no mode.
Range: 23 minus 4 = 19.
Five numbers, five different answers, all correct for their own definitions. That ordering is not a rule: in another data set the order could be different.
Midrange vs Mean
The mean uses every value, so each value pulls it a little. The midrange uses only the extremes, so only the extremes can move it. When the data are roughly symmetric, the mean and the midrange often land close together. When the data are skewed, with a long tail on one side, they can part company. The mean is usually the better default for a typical value from a full data set, because it reflects all the information.
Midrange vs Median
The median is the middle value in an ordered list. It is based on position, not on the size of the extremes, so moving the largest value further upward does not change the median at all, as long as the ordering of the middle values stays the same. The midrange, by contrast, moves by half of any change in an extreme. Increase the maximum by 10 and the midrange rises by 5. That makes the median far more resistant to outliers and the safer center measure when a data set may contain an error or a one off large value.
Midrange vs Mode
The mode asks what occurs most often, not where the center lies. A data set can have one mode, several modes, or no mode, and a mode can sit far from the midrange when most values cluster at the low end but one high value stretches the maximum upward. Use the mode for popularity or the most common value. Use the midrange for the midpoint of the span.
Midrange vs Range
The range and the midrange both use only the minimum and maximum, which is why they are confused. The range measures spread: how far apart the ends are. The midrange measures location: where the middle of that spread falls. In Example 1, the range is 19 and the midrange is 13.5. A related term is the interquartile range, often shortened to IQR: the middle 50 percent of the data, found by subtracting the 25th percentile from the 75th percentile. It is a measure of spread, not a midpoint, and it is not the midrange.
When Is the Midrange Useful?
The midrange earns its place in a few clear situations. First, when only the minimum and maximum are known: if a report gives only the daily high and low, the midrange is the only center measure you can compute from those two numbers. Second, when a fast estimate is enough, in a classroom, on a test, or in a quick check of a small list. It can also serve as a sanity check: if a claimed mean falls outside the minimum to maximum span, the claim deserves a second look. Third, when the data are roughly symmetric and free of extreme values, so the midrange, mean, and median tend to agree. For a uniform distribution, where values are spread evenly across a range with short tails, the midrange is the best estimator of location among the common choices, but that is a special case, not a general license to use it everywhere. Fourth, in quality control checks where the extremes themselves are the focus. In each case, say what it is: the midpoint of the span, not the average of all the data.
When Is the Midrange Not Useful?
The midrange is a poor choice whenever the extremes do not represent the bulk of the data. With outliers, a single extreme value can drag it far from most of the data, as the demonstration below shows. With skewed data, it is pulled toward the long tail; income data and house prices are often skewed, and the median is usually better there. With gaps in the middle, it can land in an empty region: values clustered near 10 and near 90, with nothing in between, have a midrange near 50, a value that represents almost nobody in the set. When every value must count, use the mean, because multiplying the mean by the count recovers the sum; the midrange has no such connection to the total. With categorical data, such as colors or job titles, the midrange does not apply at all. Report it with company: the minimum, the maximum, the count, and at least one of the mean or median.
Sensitivity to Outliers: A Worked Demonstration
Outlier sensitivity is the most important limitation of the midrange. Start with an example set with no outlier: 20, 22, 24, 26, 28, 30. The minimum is 20 and the maximum is 30.
Midrange: (20 + 30) / 2 = 50 / 2 = 25. Mean: 20 + 22 + 24 + 26 + 28 + 30 = 150. Divide by 6: 150 / 6 = 25. Median: the two middle values are 24 and 26. Their average is (24 + 26) / 2 = 50 / 2 = 25. Range: 30 minus 20 = 10.
All three center measures agree at 25, which is what symmetric, evenly spaced data should produce.
Now add one outlier value, 90, to the same example set: 20, 22, 24, 26, 28, 30, 90.
The minimum is still 20. The maximum is now 90.
Midrange: (20 + 90) / 2 = 110 / 2 = 55. Mean: 150 + 90 = 240. Divide by 7: 240 / 7 = 34.2857, which rounds to 34.29. Median: with 7 values, the median is the fourth value in order, 26. Range: 90 minus 20 = 70.
Compare the changes. The midrange jumped from 25 to 55, a rise of 30. The mean rose from 25 to 34.29, a rise of about 9.29. The median moved from 25 to 26, a rise of 1. The new midrange, 55, is higher than every value except the outlier itself.
The general rule is simple. Changing the maximum by an amount D changes the midrange by D / 2. Changing any interior value, as long as it stays between the minimum and maximum, does not change the midrange at all. If you find an outlier, do not quietly delete it. Investigate it first: it may be a typing error, a different unit, or a genuine extreme case. Report what you did and why, and consider reporting the median alongside the midrange.
Midrange in Grouped Data and in a Frequency Table
Grouped data need extra care, because the exact minimum and maximum may no longer be visible.
When the Table Lists Each Value and Its Frequency
If a frequency table lists each distinct value and how often it occurs, the midrange is straightforward. The minimum is the smallest listed value with a frequency above zero, and the maximum is the largest listed value with a frequency above zero. The frequencies do not enter the formula, but they confirm that the endpoints actually occur.
Example frequency table, values in points:
| Value | Frequency |
|---|---|
| 12 | 3 |
| 18 | 5 |
| 24 | 2 |
The minimum is 12 and the maximum is 24. The midrange is (12 + 24) / 2 = 36 / 2 = 18. The frequencies do not change that answer.
When the Data Are Grouped Into Classes
Grouped data are different. Values are collected into classes, such as 10 to 19 and 20 to 29, and only the count in each class is shown. The exact values inside a class are lost, so the exact minimum and maximum are also lost, unless they are given separately. Do not claim an exact midrange. Report an estimated midrange from the class limits, and label it as an estimate.
Example grouped table, prices in dollars:
| Price class | Frequency |
|---|---|
| 10 to 19 | 4 |
| 20 to 29 | 9 |
| 30 to 39 | 6 |
| 40 to 49 | 3 |
The lowest class starts at 10 and the highest class ends at 49. Using those outer limits as the estimated extremes gives an estimated midrange of (10 + 49) / 2 = 59 / 2 = 29.5 dollars. In general the grouped estimate is only an approximation. Class boundary conventions change the estimate, so state the convention you used. If the classes are written as continuous intervals, 10 to under 20 through 40 to under 50, the outer limits are 10 and 50, and the estimated midrange is (10 + 50) / 2 = 60 / 2 = 30 dollars. The difference between 29.5 and 30 comes entirely from how the class edges are written, not from the data.
A related idea is the class midpoint, sometimes called the mid-interval value. For a class from 10 to 19, a common midpoint treatment uses (10 + 19) / 2 = 14.5, and class midpoints are used to estimate the mean of grouped data by weighting each midpoint by its frequency. That is a different calculation from the midrange of the whole data set. If a question gives the original minimum and maximum as well as the table, use those original values, not the class limits.
Common Mistakes
Mistake 1: Using the middle value instead of the average of the extremes. The middle value is the median, not the midrange. In Example 1, the median is 10.5 and the midrange is 13.5.
Mistake 2: Averaging all the values and calling the result the midrange. That gives the mean: 12.17 in Example 1, not 13.5.
Mistake 3: Reporting half the range as the midrange. Half the range is the distance from the minimum to the midrange, not the midrange itself, unless the minimum is zero. In Example 1, half the range is 9.5, while the midrange is 13.5.
Mistake 4: Picking the first and last values of an unsorted list. Sort first, then read the ends.
Mistake 5: Ignoring negative signs. The minimum is the most negative value. Sorting negatives first prevents this error.
Mistake 6: Forgetting that the midrange need not appear in the data. An answer such as 13.5 for whole number data is fine.
Mistake 7: Treating the midrange as resistant to outliers. It is the most sensitive of the common center measures, because it depends entirely on the two extremes.
Mistake 8: Using grouped class limits without saying so. Label a grouped result as an estimate, with the class convention stated.
Mistake 9: Mixing up the statistical midrange with the everyday word for a middle price bracket product. That use is suggestive, not a calculation.
Mistake 10: Rounding too early. Keep full precision through the addition and division, and round only the final answer.
Practice Problems
Try these before reading the answers.
Problem 1: Find the midrange of 31, 6, 22, 15, 11.
Problem 2: Find the midrange of 45, 52, 48, 61, 57, 39.
Problem 3: An example set has values 8, 10, 12, 14, 16. Find its midrange. Then add the value 46 and find the new midrange. By how much did the midrange change?
Answers
Answer 1: Ordered: 6, 11, 15, 22, 31. Minimum 6, maximum 31. Midrange: (6 + 31) / 2 = 37 / 2 = 18.5.
Answer 2: Ordered: 39, 45, 48, 52, 57, 61. Minimum 39, maximum 61. Midrange: (39 + 61) / 2 = 100 / 2 = 50.
Answer 3: Original midrange: (8 + 16) / 2 = 24 / 2 = 12. With 46 added, the minimum is still 8 and the maximum is 46. New midrange: (8 + 46) / 2 = 54 / 2 = 27. The midrange changed by 27 minus 12 = 15. Note that the maximum rose by 30, and the midrange rose by half that amount, 15, exactly as the outlier rule predicts.
FAQ
What is the midrange in simple terms?
The midrange is the number halfway between the smallest and largest values in a data set. Add those two values and divide by 2. It is the center of the span of the data, not the average of all the values.
What is the formula for midrange?
Midrange = (minimum + maximum) / 2.
Can the midrange be a decimal when the data are whole numbers?
Yes. If the sum of the minimum and maximum is odd, dividing by 2 gives a value ending in .5. For example, values from 4 to 23 give (4 + 23) / 2 = 13.5.
Is the midrange the same as the median?
No. The median is the middle value in an ordered list, or the average of the two middle values when the count is even. The midrange is the average of the minimum and maximum. They can agree in symmetric data, but they are different measures and often differ.
Is the midrange the same as the mean?
No. The mean adds every value and divides by the count. The midrange adds only the minimum and maximum and divides by 2.
Why is the midrange sensitive to outliers?
It depends entirely on the minimum and maximum. Move the maximum up by 10 and the midrange rises by 5. Move an interior value, and the midrange does not move at all.
When should I use midrange instead of mean or median?
Use it when only the minimum and maximum are available, when a fast estimate of the center of the span is enough, or when the data are roughly symmetric and free of extremes. For a typical value from a full, possibly skewed data set, prefer the median.
How do I find the midrange from a frequency table?
If the table lists each value, take the smallest and largest listed values and average them; the frequencies do not affect the result. If the data are grouped into classes, the exact midrange cannot be recovered, so report an estimated midrange from the outer class limits, label it as an estimate, and state the class boundary convention used.
What is the difference between midrange and range?
The range is maximum minus minimum, and it measures spread. The midrange is (minimum + maximum) / 2, and it measures the center of the span. In Example 1, the range is 19 and the midrange is 13.5.
Sources & references
- NIST/SEMATECH e-Handbook of Statistical Methods, section 1.3.3.14.2, Histogram Interpretation: Symmetric, Non-Normal, Short-Tailed. States that for a uniform distribution, the midrange, defined as (smallest + largest) / 2, is the best estimator of location. Opened and read 1 Nov 2026.
- NIST/SEMATECH e-Handbook of Statistical Methods, section 1.3.5.1, Measures of Location. Discusses how extreme values distort the mean while the median, based on ranks, is not distorted in the same way, supporting the comparison of center measures in this article. Opened and read 1 Nov 2026.
- Statistics How To, Midrange: Definition and How to Find the Midrange. Gives the formula (high + low) / 2, a worked phone price example, and the distinction between midrange and range. Opened and read 1 Nov 2026.
- Sciencing, How To Calculate The Midrange, by Rosann Kozlowski, updated 24 Mar 2022. Gives the step method of ordering data, finding minimum and maximum, and applying M = (max + min) / 2, with a worked speaker price example and an outlier demonstration. Opened and read 1 Nov 2026.
- Math-Mate, Finding Means, Medians And Modes Of Grouped Data. Explains class midpoints, frequency tables, and why grouped calculations are estimates when exact values within classes are unknown. Opened and read 1 Nov 2026.


