Short answer
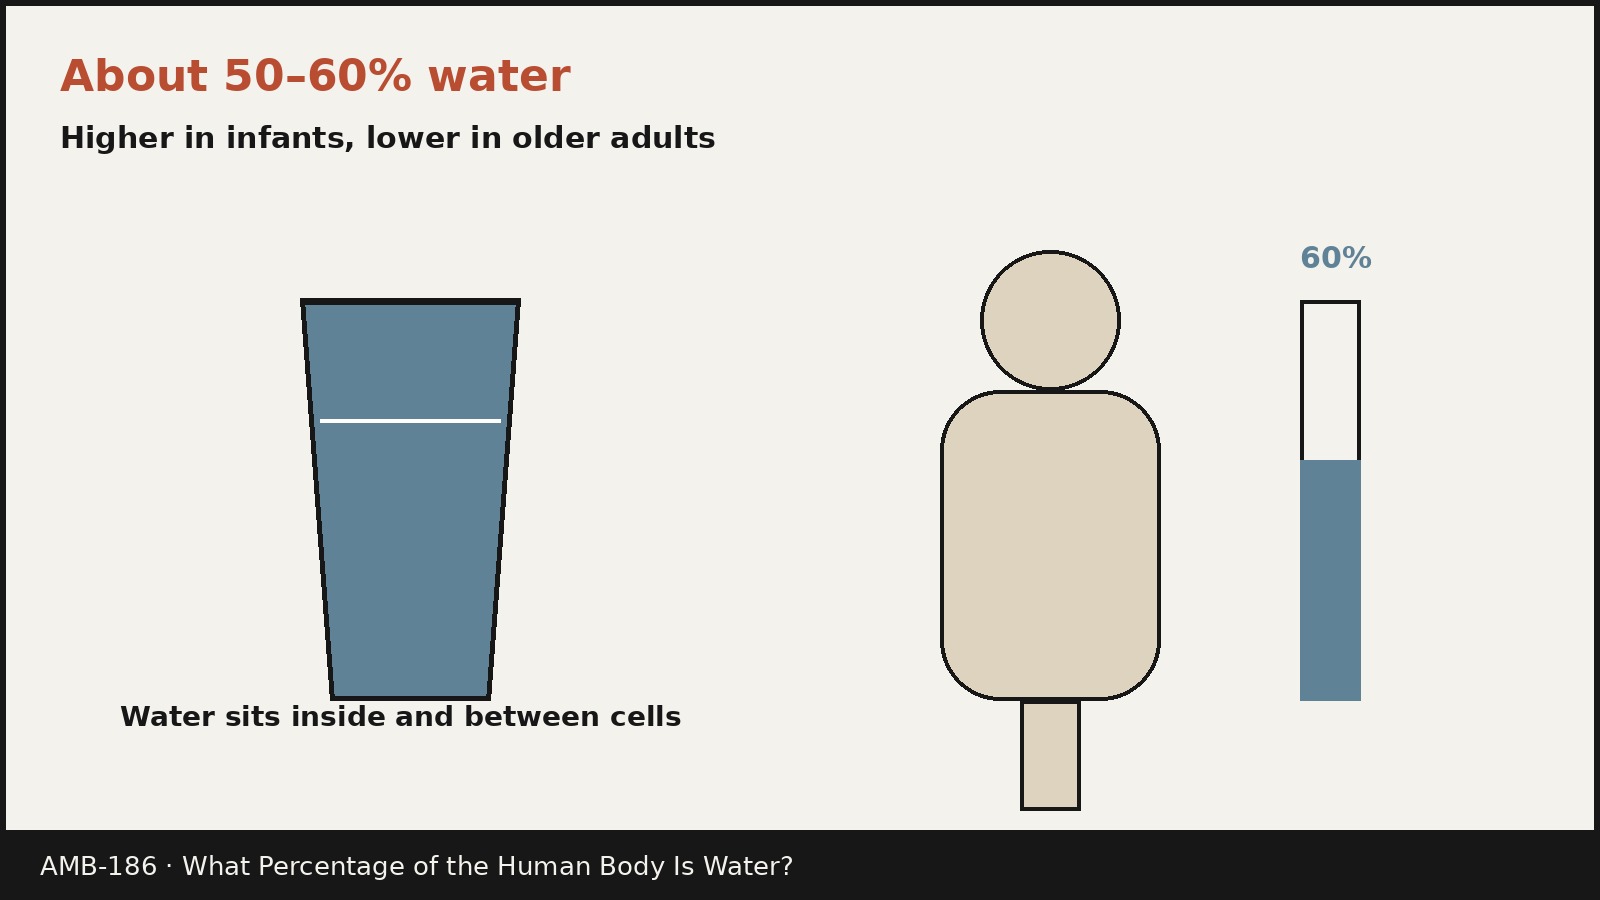
- The adult human body is roughly 50 to 60 percent water by weight, with adult men averaging around 60 percent and adult women averaging around 50 to 55 percent in the sources cited below.
- Infants carry the highest share, about 75 percent of body mass, falling to about 65 percent by one year of age.
- Older adults carry a lower share, down to about 45 percent in old age in the OpenStax range, because the proportions of muscle, fat, bone, and other tissues shift with age.
- Body composition matters more than body weight alone. Lean tissue is about 73 percent water while adipose tissue, or body fat, is about 10 percent water, so two people of the same weight can have quite different percentages.
- About two thirds of total body water is inside cells and about one third is outside cells, in the fluid between cells and in blood plasma.
- There is no single universal percentage. Every published figure is an average or a range for a defined group, measured by a particular method, and individual values vary around it.
Introduction
Ask how much of the human body is water and the most common answer is a single number, usually 60 percent. That number is not wrong as a rough average for adults, but it hides the more interesting truth. The share of the body made of water changes across a lifetime, differs between men and women on average, and depends heavily on how much of the body is muscle and how much is fat. A newborn, a lean young adult, and an older adult with a higher share of body fat do not carry the same percentage, and no single figure describes all three.
This article gives the ranges, explains what they mean, and shows where the water actually sits. It covers the figures for infants, children, adults, and older adults, the split between water inside cells and water outside them, the water content of individual organs and tissues, and the methods researchers use to measure total body water. It also explains why different reputable sources quote slightly different numbers, and which popular claims about body water do not stand up.
Why There Is No Single Number
A percentage of the human body is a ratio: total body water divided by total body weight, multiplied by 100. Both parts of that ratio vary. Body weight includes water, fat, muscle, bone, and everything else, and the mix of those parts differs from person to person. Because fat holds far less water than muscle, a person with a higher share of body fat will show a lower water percentage even at the same total weight as a leaner person. Age changes the mix too, as the share of muscle tends to fall and the share of fat tends to rise across adult life, while bone and other tissues change in their own ways.
Measurement adds a second layer of variation. Researchers do not drain the body and weigh the water. They estimate total body water indirectly, and different methods give slightly different answers, as the measurement section below explains. Sample differences matter as well: a study of young athletes, a study of adults over 75, and a general textbook average describe different populations, so their headline numbers should differ.
That is why this article quotes ranges with attribution throughout. The familiar 60 percent is best understood as a convenient adult average, not as a measurement of any particular person.
The Percentages by Age and Sex
The clearest pattern in the data is the change across the lifespan. OpenStax Anatomy and Physiology 2e, in the version hosted by Oregon State University, puts it this way: human beings are mostly water, ranging from about 75 percent of body mass in infants to about 50 to 60 percent in adult men and women, to as low as 45 percent in old age. The United States Geological Survey (USGS) Water Science School gives a compatible picture with slightly different round numbers: babies are born at about 78 percent water, falling to about 65 percent by one year of age, with adult men at about 60 percent and adult women at about 55 percent.
A study of 324 community dwelling adults with a mean age of 80.1 years, published in Nutricion Hospitalaria and held in PubMed Central, gives a concrete example: total body water was 56.7 percent of body weight in men and 48.4 percent in women, measured by bioelectrical impedance analysis. Those figures sit below the general adult averages, fitting the pattern of lower total body water in older age.
The table below brings the main published ranges together. Read each row as a description of a group, not as a target for an individual.
| Group | Approximate share of body weight that is water | Source |
|---|---|---|
| Newborn infants | About 75 to 78 percent | OpenStax; USGS |
| Infants at one year | About 65 percent | USGS |
| Adult men, general average | About 60 percent | USGS; OpenStax adult range |
| Adult women, general average | About 50 to 55 percent | OpenStax adult range; Serra-Prat and colleagues |
| Adults over 75 in one study sample | 56.7 percent (men), 48.4 percent (women) | Serra-Prat and colleagues |
| Older adults, low end of the range | Down to about 45 percent | OpenStax |
Two cautions apply to this table. First, the sex difference is explained in the sources mainly by average differences in body composition: on average, women carry a higher share of body fat than men, and fat holds less water than lean tissue. Second, the ranges overlap, because individual body composition varies more within each group than the group averages differ from each other.
Where the Water Sits: Fluid Compartments
Total body water is not one undifferentiated pool. Physiologists divide it into compartments separated by physical barriers, and the division explains a great deal about how the body works.
The largest compartment is intracellular fluid, the fluid inside cells. OpenStax states that intracellular fluid makes up about 60 percent of the total water in the human body, and that in an average size adult male it accounts for about 25 liters of fluid. A pie chart in the same chapter puts intracellular fluid at about 55 percent, a small difference that shows even within one textbook these shares are approximate.
The rest of total body water is extracellular fluid, the fluid outside cells, accounting for roughly one third of total body water. Extracellular fluid has two main parts. One is interstitial fluid, the fluid in the spaces between cells, which is the larger of the two. The other is plasma, the fluid component of blood, in which blood cells are suspended. OpenStax notes that approximately 20 percent of extracellular fluid is found in plasma. Beyond those two main parts, extracellular fluid includes a collection of smaller fluids: cerebrospinal fluid bathing the brain and spinal cord, lymph in lymphatic vessels, synovial fluid in joints, pleural fluid in the pleural cavities, pericardial fluid around the heart, peritoneal fluid in the abdominal cavity, and aqueous humor in the eye.
The classic teaching summary is the 60-40-20 rule: if total body water is about 60 percent of body weight, then roughly 40 percent of body weight is intracellular fluid and roughly 20 percent is extracellular fluid. Those are rounded teaching figures for a typical adult, not measurements of a particular person.
The compartments are not sealed off from each other. Water moves between them by osmosis, driven by the balance of solutes on each side: intracellular fluid is rich in potassium, phosphate, magnesium, and protein, while extracellular fluid is rich in sodium, chloride, and bicarbonate. Sodium potassium pumps in cell membranes use energy to maintain that difference. When water is lost from one compartment, for example through sweating, water shifts from other compartments to rebalance.
Water Content of Organs and Tissues
Just as the whole body average hides variation between people, it hides variation between parts of the body. Some tissues are mostly water. Others hold very little.
OpenStax gives the following ranges for organs and tissues: the brain and kidneys at 80 to 85 percent water, the lungs and heart at 75 to 80 percent, the liver, skin, and muscles at 70 to 75 percent, bones at 20 to 25 percent, and teeth at only 8 to 10 percent. Those figures describe the water content of each tissue itself, not its share of total body water. The brain is a small fraction of body weight, so even at 80 percent water it contributes far less total water than muscle, which is both water rich and a large share of body mass.
An older set of figures comes from Mitchell and colleagues in 1945, as reported by the USGS: the brain and heart at 73 percent water, the lungs at about 83 percent, the skin at 64 percent, muscles and kidneys at 79 percent, and bones at 31 percent. The mismatch is instructive: the Mitchell figures are more than 80 years old and use tissue definitions that may not line up exactly with modern ones. Neither set should be quoted to single digit precision, and the honest summary is that metabolically active soft tissues are roughly three quarters water, bones roughly one quarter to one third, and teeth under one tenth.
Why Age, Sex, and Body Composition Change the Figure
Three factors explain most of the variation between groups, and they overlap.
Age comes first. Infants have a high water percentage partly because their bodies have a high share of lean tissue and a relatively low share of fat, and partly because their organs and tissues are proportioned differently from adults. As children grow, the percentage falls toward the adult range, and in later life it continues downward in the textbook range as tissue proportions shift. In the older adult study cited above, total body water as a share of body weight was not correlated with age within the over 75 group itself, although intracellular water as a share of total body water fell with age in the sample overall and in men.
Sex differences in the averages come second, and they run through body composition. A 2018 study introduction in PubMed Central states the standard figures plainly: water is approximately 60 percent of body weight in adult men and 50 to 55 percent in adult women, and older persons, women, and people with obesity have lower total body water because of their lower lean body mass. The mechanism is the third factor, body composition, and it is the most powerful of the three.
Lean body mass is about 73 percent water and adipose tissue is about 10 percent water, according to the same study introduction. That sevenfold gap means that body composition swamps most other differences. A lean adult and an adult with obesity of the same sex and age can differ in water percentage by ten points or more, which is why textbook tables sometimes give separate rows for lean and obese body types. In Table 1 of the Medicine LibreTexts page ‘Water Content Within the Body,’ total body water is 70 percent for a lean adult man and 60 percent for a lean adult woman, against 50 percent and 42 percent for an obese adult man and woman respectively. Those are teaching figures for defined body types, not measurements of individuals, but they show the scale of the composition effect.
What Body Water Does
Water is not a passive filler. It is the medium in which the chemistry of life takes place, and the USGS and OpenStax accounts agree on its main roles.
First, water is a solvent and a transport medium. It carries nutrients to cells and waste products away from cells toward excretion, and the carbohydrates and proteins the body uses as food are metabolized and transported by water in the bloodstream, in the USGS account.
Second, water is a reactant and a reaction medium. Many biochemical reactions take place in aqueous solution, and water itself takes part in some of them, including hydrolysis, in which water molecules are used to break down a larger molecule. Cells are full of water, and the water inside cells provides the environment in which cellular chemistry runs.
Third, water regulates temperature. It absorbs heat and releases it through perspiration and respiration, and sweating cools the body as water evaporates from the skin.
Fourth, water provides lubrication and protection. It makes up saliva and the fluids surrounding the joints, it lubricates joints, and it acts as a shock absorber for the brain, spinal cord, and fetus, in the USGS account. Cerebrospinal fluid, synovial fluid, and the other small extracellular fluids listed earlier are all examples of water doing structural and protective work in specific places.
Finally, water gives cells and tissues their shape. If the amount of water inside a cell falls too low, the cytosol becomes too concentrated with solutes to carry on normal cellular activities, in the OpenStax account, and if too much water enters a cell, the cell may burst. Keeping water in the right compartments is therefore a continuous job, not a one time setting.
How Researchers Measure Total Body Water
Because total body water cannot be weighed directly in a living person, every published percentage rests on an indirect method, and the method shapes the precision of the result.
The reference method in research is dilution. In deuterium dilution, a participant takes a measured dose of water in which some hydrogen atoms are the heavier isotope deuterium, and after an equilibration period of several hours, during which the labeled water mixes evenly through body water, a urine or saliva sample is analyzed to find how much the label has been diluted. From the dilution, total body water can be calculated. A 2020 study of athletes in PubMed Central describes the procedure in detail: a dose of 0.1 grams of 99.9 percent deuterium oxide per kilogram of body weight, a four hour equilibration period with no food or drink, and analysis by stable isotope ratio mass spectrometry. Extracellular water can be measured separately by bromide dilution, using a measured dose of sodium bromide, and intracellular water is then calculated as total body water minus extracellular water.
Bioelectrical impedance analysis is the faster, more widely used alternative. A small alternating current is passed through the body, and the resistance and reactance it meets are related to fluid volume, because fluids conduct electricity while fat resists it more. The raw values are then converted into estimates using equations developed from populations measured by a reference method. The same 2020 study used bioelectrical impedance spectroscopy at 50 kilohertz alongside dilution methods in 273 athletes, and found that resistance explained total body water and extracellular water, while phase angle predicted intracellular water. The limitation is clear: results depend on the equation and the population it came from, and they are estimates with error, not direct measurements.
Other methods include dual energy X-ray absorptiometry, which measures fat mass and fat free mass, from which total body water can be inferred, and simple prediction equations based on height, weight, age, and sex. Those equations describe an average person with given characteristics, and they will miss by more for people who differ from the population the equation was built on.
This is also why figures from consumer devices that report a body water percentage should be read as estimates. They use bioelectrical impedance and a built in equation, and their output moves with hydration state, recent food and drink, and skin temperature, as well as with genuine changes in body composition. A single reading is far less informative than the population ranges in this article.
Water In, Water Out, and Balance
Total body water stays roughly stable over time in a healthy adult because intake and loss are matched by regulation, even though the water itself turns over continuously. The older adult study introduction summarizes the flows: water inputs come mainly from diet, meaning food and fluids, with small quantities also coming from metabolic activity, while water losses occur mainly in urine and sweat, and also through feces, skin, and respiration.
Regulation is handled largely by the kidneys, which can concentrate or dilute urine depending on metabolic wastes and water intake, and by hormones that adjust how much water the kidneys retain or release, including antidiuretic hormone, aldosterone, and atrial natriuretic peptide. Osmotic pressure provides the physical signal: when solute concentration rises on one side of a membrane, water moves toward it by osmosis, restoring balance.
Reference values for total water intake give a sense of the scale of turnover, without describing any individual. MedlinePlus cites Dietary Reference Intake values of 91 to 125 fluid ounces, or 2.7 to 3.7 liters, of total water per day for adults, from food and beverages combined, and notes that individual needs depend on sex, weight, age, and activity level, as well as medical conditions. Those are population reference values for total intake, not a measure of body water percentage, and they should not be confused with it. A person can take in several liters of water a day while their body water percentage stays in its usual range, because intake replaces loss rather than accumulating.
What the Percentage Does Not Tell You
A body water percentage is a useful summary, but it has limits that are worth stating plainly.
It does not say how much water is in any one place. Two people with the same total percentage can differ in how their water is split between cells and extracellular fluid. The older adult study is a case in point: intracellular water as a share of total body water varied considerably even among people with similar muscle mass.
It does not distinguish bound water from free water. Some water is bound to proteins and other large molecules, or trapped in structures such as bone mineral, and it does not behave exactly like the free water in plasma or inside cells. Published percentages count total body water, so they smooth over that distinction.
It is a share by weight, not by volume. Because different tissues have different densities, a percentage by weight and a percentage by volume would not be identical, although the literature quotes percentages by weight unless it says otherwise. It is also a snapshot: total body water changes across the day with drinking, eating, sweating, and urination, and across longer periods with changes in body composition.
Finally, a population average is not a personal measurement. Knowing that adult men average about 60 percent water does not tell you the figure for a particular man, any more than knowing average height tells you the height of a particular person. The ranges in this article describe groups. Individual values require individual measurement by a method such as those described above, interpreted in context.
Common Myths About Body Water
Myth: Everyone is 60 percent water. The 60 percent figure is a reasonable adult average, but it fails for infants at about 75 percent, for many women at 50 to 55 percent, and for older adults down toward 45 percent. It also fails for people whose body composition differs from the average. Quoting 60 percent for a baby or for an older adult with obesity would understate or overstate the true group figure by a wide margin.
Myth: The human body is 90 percent water. This figure appears occasionally in popular writing, perhaps from confusing the human body with organisms that really are mostly water, or from confusing the water content of certain tissues with the whole body average. No source cited here puts whole body water near 90 percent: newborn infants are around 75 to 78 percent, and adult figures cluster between 45 and 65 percent.
Myth: Drinking more water permanently raises your body water percentage. Total body water is regulated, not stored without limit. Extra intake is matched by extra loss through the kidneys and other routes, so the percentage returns toward its range for a given body composition. What changes the percentage over weeks and months is mainly a change in body composition, especially muscle and fat mass, not a change in how much water was drunk on a given day.
Myth: Fat contains no water. Adipose tissue holds much less water than muscle, but it is not dry. The figure used in the research literature is about 10 percent water for adipose tissue, against about 73 percent for lean body mass. That gap is large enough to drive the whole body differences described earlier, but it is not a gap between water and nothing.
Myth: A single published figure settles the question. Even reputable sources differ: the USGS, quoting 1945 work, puts the brain at 73 percent water, while OpenStax puts it at 80 to 85 percent. The difference reflects different samples, methods, tissue definitions, and dates. The right response is to quote a range, name the source, and say what group it describes.
Frequently Asked Questions
What percentage of the human body is water?
For adults, roughly 50 to 60 percent by weight, with adult men averaging around 60 percent and adult women around 50 to 55 percent. Infants are higher, at about 75 percent, and older adults lower, down to about 45 percent at the low end of the OpenStax range. No single figure fits everyone, because the percentage depends on age, sex, and body composition.
Are babies really mostly water?
Yes: water is the largest single component of an infant body by weight. Newborn infants are about 75 to 78 percent water, falling to about 65 percent by one year of age in the USGS account, reflecting the different tissue proportions of early life.
Do men and women have different water percentages?
On average, yes: adult men average around 60 percent water and adult women around 50 to 55 percent in the sources cited here, mainly because women on average carry a higher share of body fat, and fat holds far less water than lean tissue. Individual values overlap considerably between the sexes.
Does body water percentage fall with age?
In broad terms, yes: the textbook range runs from about 75 percent in infants, through 50 to 60 percent in adults, to as low as 45 percent in old age. Within a narrow older age group the pattern is less tidy: in one study of adults over 75, total body water as a share of body weight was not correlated with age within that group, although the split between intracellular and extracellular water did shift with age.
Where is most of the water in the body?
Most of it is inside cells. Intracellular fluid accounts for roughly 55 to 60 percent of total body water, with the rest outside cells, mainly as interstitial fluid and plasma, plus smaller fluids such as cerebrospinal fluid and lymph. By tissue, muscle contributes the most total water in most adults, because it is both water rich at 70 to 75 percent and a large share of body mass.
Which organ has the highest water content?
By percentage of the tissue itself, the brain and kidneys lead in the OpenStax figures, at 80 to 85 percent water each, followed by the lungs and heart at 75 to 80 percent. By total amount contributed, muscle matters more, because there is far more of it. Teeth sit at the other end, at only 8 to 10 percent water, with bones at 20 to 25 percent in OpenStax, or 31 percent in the older Mitchell figures.
Why do different websites give different percentages?
Because they describe different groups, use different methods, or date from different eras. A general adult average, a study of athletes, a study of adults over 75, and a 1945 chemical analysis will not give identical numbers. Look for the group described, the method used, and the date, and prefer ranges with named sources over single figures with no attribution.
Is body water percentage the same as hydration?
No, not exactly. Body water percentage describes how much of body weight is water in total, which is set mainly by body composition and age. Hydration describes the current state of fluid balance, which shifts across the day with intake and loss. A person can have a stable body water percentage for their body composition while their fluid balance moves up and down around it. Anyone concerned about fluid balance or a condition that affects it can discuss the question with a qualified health professional.
Sources & references
- United States Geological Survey, Water Science School, "The Water in You: Water and the Human Body" (adult body up to 60 percent water; organ figures from Mitchell and colleagues, 1945; infant figures; functions of water).
- OpenStax Anatomy and Physiology 2e, Chapter 26.1, "Body Fluids and Fluid Compartments," Oregon State University adaptation (infant to old age range; organ and tissue water content; intracellular and extracellular compartments; solute composition; osmosis and fluid movement).
- National Library of Medicine, MedlinePlus Medical Encyclopedia, "Water in diet" (water as the basis of body fluids; functions; Dietary Reference Intake values for total water; sources of body water).
- Serra-Prat, Mateu, and colleagues, "Total Body Water and Intracellular Water Relationships with Muscle Strength, Frailty and Functional Performance in an Elderly Population," Nutricion Hospitalaria, via PubMed Central (adult men about 60 percent, adult women 50 to 55 percent; lean body mass about 73 percent water, adipose tissue about 10 percent; water inputs, losses, and kidney regulation; sample values for adults over 75).
- Francisco, Ruben, and colleagues, "The Predictive Role of Raw Bioelectrical Impedance Parameters in Water Compartments and Fluid Distribution Assessed by Dilution Techniques in Athletes," International Journal of Environmental Research and Public Health, 2020, via PubMed Central (deuterium dilution and bromide dilution procedures; bioelectrical impedance methods and their relationship to dilution measures).
- Medicine LibreTexts, 'Water Content Within the Body' (Table 1: total body water by body type).


