Short answer
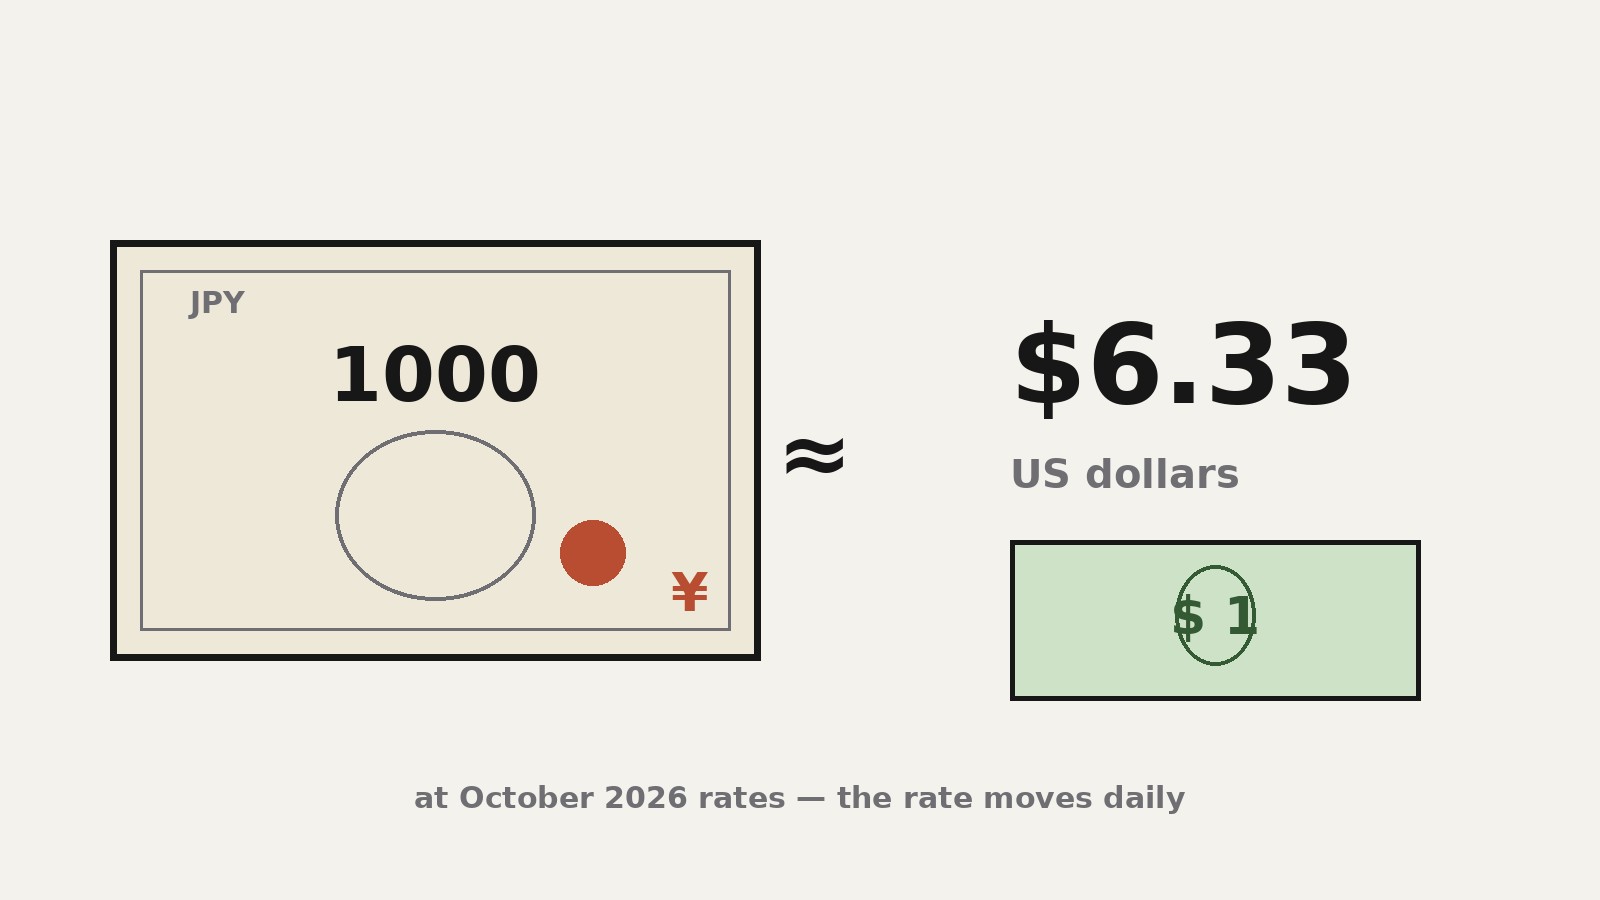
- At the Federal Reserve's noon rate of about 158 yen per dollar on October 16, 2026, 1,000 Japanese yen converts to roughly $6.33. The figure moves with the market, so treat any number here as a dated illustration, not a live quote.
- The yen-dollar rate is a market price, not a number set by a government. Japan and the United States both operate floating exchange rate regimes, which means the rate is set by buying and selling in the foreign exchange market.
- To convert yen to dollars yourself, divide the yen amount by the yen-per-dollar rate. To convert dollars to yen, multiply the dollar amount by the same rate.
- Interest-rate gaps, inflation expectations, trade and investment flows, shifts in risk mood, and occasional official intervention are the main forces that move the rate.
- The rate you see on a converter is usually the mid-market rate. Banks and transfer services add a spread or fee, so the amount you actually receive is lower. This article explains the mechanics only; it is not financial advice.
Searching “1000 jpy to usd” usually brings up a row of converter pages that each answer with a single number. That number is useful, but it is also fragile: by tomorrow, or by this afternoon, it may have changed. This article goes behind the number. It shows how to do the conversion yourself in either direction, explains who or what actually sets the yen-to-dollar rate, walks through the forces that push it up and down, and shows why the rate on a converter screen is rarely the rate you end up with. Every rate figure below is date-stamped so you can tell exactly when it applied.
A note on what this article is: a general explanation of how currency exchange works. It is not financial advice, it does not recommend any timing or method for converting money, and it makes no promises about where the rate will go.
What 1,000 Yen Is Worth in Dollars
Start with the direct answer. In its H.10 statistical release for the week of October 19, 2026, the U.S. Federal Reserve reported the noon buying rate in New York City at 158.3600 yen per dollar on October 13, 158.8400 on October 14, 158.1800 on October 15, and 158.0000 on October 16. Using the October 16 figure:
1,000 yen divided by 158.00 yen per dollar = $6.3291, or about $6.33.
At the October 13 rate, the same 1,000 yen would have come to about $6.31. That small shift, from $6.33 to $6.31 and back, is the ordinary daily motion of the currency market. The rate is quoted to four decimal places by the Federal Reserve, which looks precise, but the precision only describes the market at noon on that day. By the next business day the market will have moved again.
Notice what these figures imply about the yen. One yen is worth about six-tenths of one US cent. That is not a statement about Japan’s economy; it is a statement about the unit of account. Japan’s currency unit is simply small relative to the dollar, the way a centimeter is small relative to an inch. The number of yen per dollar is large because each yen is small, not because Japan is in any particular trouble.
It helps to fix one convention before going further. In the United States, the yen-dollar rate is quoted as yen per dollar: the number of yen you get for one dollar. When that number rises (say, from 150 to 160), the dollar is strengthening and the yen is weakening, because each dollar buys more yen. When it falls (say, from 160 to 150), the yen is strengthening. Keep this direction straight and the rest of the article reads cleanly.
How to Convert Yen to Dollars Yourself
You do not need a converter to do this conversion. You need one number, the current yen-per-dollar rate, and one operation.
Yen to dollars: divide. Take the yen amount and divide it by the yen-per-dollar rate.
Dollars to yen: multiply. Take the dollar amount and multiply it by the yen-per-dollar rate.
Using the Federal Reserve’s October 16, 2026 noon rate of 158.00:
| Amount | Calculation | Result |
|---|---|---|
| 1 yen | 1 / 158.00 | about $0.0063 |
| 10 yen | 10 / 158.00 | about $0.06 |
| 100 yen | 100 / 158.00 | about $0.63 |
| 500 yen | 500 / 158.00 | about $3.16 |
| 1,000 yen | 1,000 / 158.00 | about $6.33 |
| 10,000 yen | 10,000 / 158.00 | about $63.29 |
The other direction works the same way. At 158.00 yen per dollar, $1 buys ¥158, $50 buys ¥7,900, and $100 buys ¥15,800. The math is simple enough to do in your head to a rough accuracy: divide by 160 for a quick estimate (1,000 yen is roughly $6.25 at that rate), then refine with the actual rate.
A worked example shows why the direction matters. Suppose you are looking at a price tag in Tokyo of ¥5,000 and you want to know the dollar cost. Divide: 5,000 / 158.00 = $31.65. Now reverse it: suppose you have $31.65 and want to know the yen value. Multiply: 31.65 x 158.00 = ¥5,000.7, which rounds to ¥5,000. The operations are inverses of each other, which is all you need to remember: one rate, divide going one way, multiply going the other.
Two practical details complete the picture. First, currency markets do not trade in fractions of a yen the way retail prices do. Wholesale quotes run to several decimal places, while the cash and retail world rounds to whole yen. Second, the rate you plug into this math should match the rate you can actually trade at. A converter’s headline number is usually the mid-market rate, the midpoint between the buy and sell prices. Nobody sells you currency at the mid-market rate; providers add their margin on top, which the next sections explain.
Where the Rate Comes From: Nobody Sets It
One of the most common misunderstandings about exchange rates is that some authority sets them. For the yen and the dollar, that is not how it works. Both Japan and the United States operate floating exchange rate regimes. The International Monetary Fund, which classifies every member country’s exchange rate arrangement, describes floating rates plainly: the floating exchange rate is mainly market determined. In countries that let their exchange rates float, central banks intervene mostly to limit short-term fluctuations, and the IMF notes that in a few countries, including the United States, the central bank almost never intervenes to manage the exchange rate. Floating regimes, the IMF adds, let countries keep an independent monetary policy, and almost all advanced economies use them.
So where does the number come from? It comes from the foreign exchange market, which is the largest financial market in the world: a continuous, decentralized market where banks, companies, investment funds, and central banks buy and sell currencies around the clock on business days. When more market participants want dollars and are willing to pay yen for them, the yen-per-dollar number rises. When more want yen, it falls. The rate on the screen at any moment is simply the price at which the most recent trades happened.
Official reference rates turn that continuous trading into the tidy daily numbers you see quoted. The Federal Reserve publishes its H.10 release, a set of noon buying rates in New York City for cable transfers payable in foreign currencies, based on data compiled from market trading. The Bank of Japan publishes its own daily foreign exchange rates every business day, a practice it has followed since January 4, 2007; the bank explains that the figures are based on information from market participants, and that its published dollar-yen spot rates at 9:00 and 17:00 Japan time are the mid rates of the bid and offer rates. The bid is what buyers will pay; the offer is what sellers will accept; the mid is the average of the two. These reference rates are snapshots of the market, taken at defined times and places, not prices at which you can trade.
The distinction between bid, offer, and mid matters because it is the source of one of the most persistent confusions in currency conversion. A converter showing 158.00 yen per dollar is showing you a mid-market number. A bank offering to sell you dollars at 160.50 and buy them back at 155.50 is not contradicting the converter; it is quoting its own bid and offer, with a margin built in for its trouble. Both numbers describe the same market. They just describe different sides of it.
What Moves the Yen-Dollar Rate
If the rate is a market price, the next question is what moves that price. Five forces do most of the work.
Interest-rate gaps
The single most watched driver of the yen-dollar rate is the gap between US and Japanese interest rates. The logic is straightforward. Money tends to flow toward the higher yield. When US rates are well above Japanese rates, investors have an incentive to hold dollars and dollar assets rather than yen, which supports the dollar and weighs on the yen. When the gap narrows, that incentive fades and the yen tends to find support.
As of October 2026, the gap is wide. On September 16, 2026, the Federal Reserve’s Federal Open Market Committee raised the target range for the federal funds rate to 3.75 to 4 percent, effective September 17, 2026. Two days later, on September 18, 2026, the Bank of Japan’s Policy Board voted 7 to 2 to encourage the uncollateralized overnight call rate to remain at around 1.25 percent, with the interest rate on banks’ deposits at the central bank also set at 1.25 percent and the basic loan rate at 1.5 percent. The difference between the two policy stances is therefore on the order of two and a half to two and three-quarter percentage points, with US rates higher.
That gap explains a pattern that puzzles casual observers: the yen can stay weak even while the Bank of Japan is raising rates. A rate hike in Tokyo only changes the rate gap by the amount it exceeds expectations and by how it changes what the market expects next. What matters for the currency is the relative position of the two central banks, not either one in isolation. It also explains the carry trade, a widely used strategy in which investors borrow in low-rate yen and invest the proceeds in higher-yielding dollar assets, pocketing the difference. As long as the gap persists and markets stay calm, carry trades add a steady flow of yen selling and dollar buying, which leans against yen strength.
Inflation and the central banks
Behind interest rates sits inflation. Central banks raise rates to keep inflation near target and cut them when the economy needs support, so anything that changes the inflation outlook tends to move rate expectations and, with them, the currency. The Federal Reserve’s stated goal is 2 percent inflation; the Bank of Japan also targets 2 percent. When US inflation data runs hot, markets tend to expect the Fed to keep rates higher for longer, which supports the dollar. When Japanese inflation data runs hot, markets tend to expect the Bank of Japan to tighten further, which supports the yen. Neither link is mechanical, and the market’s expectations of future policy usually move the rate before the policy itself changes.
Trade and investment flows
Currencies are also bought and sold for real economic reasons. Japanese exporters earn dollars abroad and eventually convert some of those earnings into yen to pay wages and taxes at home; US importers of Japanese goods need yen to pay Japanese suppliers. Investment flows are larger still: Japanese pension funds and insurers are among the world’s biggest buyers of foreign bonds, which means steady structural demand for dollars, while foreign investors buying Japanese stocks and bonds create demand for yen. None of these flows dominates on any given day, but their balance sets the background pressure on the rate over months and years.
Risk mood and the yen
The yen has a well-known tendency to strengthen when financial markets turn fearful and weaken when they turn confident. Part of the mechanism runs through the carry trades described above: when volatility spikes, leveraged positions get unwound, and unwinding a yen-funded carry trade means buying back yen, which pushes the rate down in yen-per-dollar terms. Japan’s position as a large creditor nation, with Japanese investors holding vast assets abroad, adds a second channel: in a panic, some of that money comes home, and bringing it home means selling foreign currency and buying yen. This is a description of how the plumbing works, not a prediction; the yen does not strengthen in every episode of stress, and the pattern can break down.
Official intervention
The IMF’s framework allows for intervention even under floating regimes: central banks may step in, buying or selling currency, mostly to limit short-term fluctuations. Japan has done this at times in its history, with the Ministry of Finance directing and the Bank of Japan executing operations in the market. Intervention does not change the underlying rate gap or trade flows, so its effects tend to be temporary unless the fundamentals move with it. The United States, for its part, is in the IMF’s category of countries whose central bank almost never intervenes to manage the exchange rate. For a reader converting 1,000 yen, the practical takeaway is simpler: intervention episodes are one reason the rate can lurch suddenly even when no economic data has been released.
The Rate on the Screen Versus the Rate You Get
Return to the $6.33 figure from the start of this article. That is the value of 1,000 yen at the mid-market rate. It is not the amount you would receive if you handed 1,000 yen to a bank, a currency exchange booth, or a transfer app and asked for dollars. The difference is the provider’s margin, and understanding it saves more money than any amount of rate-watching.
Every retail currency provider quotes two prices: the price at which it buys your currency and the price at which it sells you currency. The gap between them is the spread. A provider might buy yen from you at 155.50 per dollar and sell dollars to you at 160.50, with the mid-market rate sitting at 158.00. On top of the spread, providers often charge an explicit fee, a flat amount or a percentage of the transaction. The total cost to you is the spread plus the fee, and providers differ enormously in how they split the two. Some advertise “zero fees” while building a wide spread into the rate; others show a narrow spread and a separate fee.
A worked example makes the arithmetic concrete. Suppose the mid-market rate is 158.00 yen per dollar, so 1,000 yen is worth $6.33 at mid-market. If a provider applies an effective markup of 3 percent (a plausible all-in figure for a retail counter, used here as an illustration only), you receive $6.33 x 0.97 = $6.14. The $0.19 difference is the provider’s margin on a small transaction. On larger amounts the same percentage bites harder: at a 3 percent all-in cost, converting ¥1,000,000 (about $6,329 at the mid-market rate used here) costs about $190 in margin. This is why comparison matters far more than timing for ordinary conversions: the spread between providers is often several times larger than the rate’s movement over a day.
To compare providers fairly, ignore the advertised rate and the advertised fee separately, and compare one number: how many dollars you receive for your yen, after all spreads and fees. A provider quoting a slightly worse rate with no fee can easily beat a provider quoting a slightly better rate with a steep fee. Airport booths and hotel desks, which serve customers with no alternative, historically offer the widest spreads; specialist transfer services and multi-currency accounts tend to sit closer to the mid-market rate. None of this is a recommendation of any provider. It is a description of how the pricing works, so you can do the comparison yourself.
The Yen-Dollar Rate in Historical Context
Today’s rate of roughly 158 yen per dollar (as of October 2026) only means something in comparison. The Federal Reserve’s daily yen series, which begins on January 4, 1971, opened at 357.73 yen per dollar. The series spans more than five decades of market-determined rates, and its range shows the rate has no natural home: it opened near 358 in 1971 and averaged about 158.85 in August 2026.
The recent era tells the opposite story. The Federal Reserve’s monthly averages show the yen sliding from about 147.48 per dollar in August 2025 to about 158.85 in August 2026, a weakening of roughly 7 to 8 percent over twelve months. July 2026 averaged 162.33, the weakest monthly reading in the series shown, before the rate eased back toward 158 in October 2026. These are averages of daily market rates, not records of anything unusual; they describe a year in which the US-Japan interest-rate gap stayed wide and the market priced it in.
Two things follow from the history. First, the rate has no natural home. It has been above 350 and below 100 within the span of the Fed’s daily series, so any claim that the current level is “high” or “low” needs a timeframe attached. Second, the trend over the past several years has been a weaker yen, driven mainly by the interest-rate gap described above. Nothing in the history says where the rate goes next. History explains how it got here; it does not forecast.
Why Yen Amounts Look So Big
Readers meeting Japanese prices for the first time often do the double take: a bowl of noodles costs ¥1,000, a train ticket ¥300, a nice dinner ¥8,000. The numbers look large because each yen is a small unit. The convention of quoting yen per dollar, rather than dollars per yen, reinforces the effect: the number is always in the hundreds, so small percentage moves show up as big-looking point moves. A move from 158 to 160 is a change of about 1.3 percent, but it reads as “two whole yen.”
The yen also has a subunit, the sen, with 100 sen to the yen. Sen-denominated prices are a historical curiosity rather than a part of modern life; everyday prices are set in whole yen, which is one reason the figures look so round and so large. There is nothing economically meaningful about the size of the numbers. It is an artifact of where the decimal point sits.
Frequently Asked Questions
How much is 1,000 yen in US dollars?
At the Federal Reserve’s noon buying rate of 158.00 yen per dollar on October 16, 2026, 1,000 yen converts to about $6.33 at the mid-market rate. The rate changes constantly during market hours, so any figure you read is a snapshot. The amount a bank or transfer service actually gives you will be lower, because providers add a spread or fee.
How do I convert yen to dollars without a calculator app?
Divide the yen amount by the yen-per-dollar rate. At a rate of 158, dividing by 160 gives a quick mental estimate (1,000 yen is roughly $6.25), and dividing by the exact rate refines it. To go the other way, multiply the dollar amount by the rate. These operations use the mid-market rate; your provider’s rate will differ.
Why does the yen-to-dollar rate change every day?
Because it is a floating market price. Banks, companies, funds, and central banks trade yen and dollars continuously on business days, and the rate moves with supply and demand. Interest-rate expectations, inflation data, trade and investment flows, shifts in risk sentiment, and occasional official intervention all feed into that supply and demand.
What is the mid-market rate?
The mid-market rate is the midpoint between the buy price (bid) and the sell price (offer) in the wholesale currency market. The Bank of Japan’s published daily dollar-yen rates, for example, are explicitly the mid rates of the bid and offer rates at 9:00 and 17:00 Japan time. It is the fairest single number for the market rate, but it is not a price any retail provider will offer you. Retail providers buy below it and sell above it; the gap is their margin.
How much does it cost to convert yen to dollars?
It depends on the provider. The total cost is the spread (the difference between the provider’s buy and sell prices) plus any explicit fee. As an illustration only: at a mid-market rate of 158 yen per dollar, a 3 percent all-in markup turns $6.33 of mid-market value on 1,000 yen into about $6.14 received. Compare providers on the final amount you receive, after all costs, rather than on the advertised rate or the advertised fee alone.
Is 1,000 yen a lot of money?
In Japan, ¥1,000 is an ordinary everyday amount: it buys a casual lunch, a few train rides, or a paperback book, depending on the city. In dollars it is about $6.33 at October 2026 rates, which reflects the small size of the yen as a unit rather than any comment on purchasing power. What ¥1,000 buys in Tokyo versus what $6.33 buys in an American city is a separate question about local prices, not exchange rates.
Where do official yen-dollar rates come from?
Two widely cited sources are the U.S. Federal Reserve’s H.10 release, which publishes noon buying rates in New York City for foreign currencies, and the Bank of Japan’s daily foreign exchange rates, published every business day since January 4, 2007 and based on information from market participants. Both are reference snapshots of market trading, not tradable prices.
Keep reading: What Is a Recession? The Official Definition Explained
Keep reading: What Is a Savings Bond? Series EE and Series I Explained
Sources & references
- Board of Governors of the Federal Reserve System, Foreign Exchange Rates, H.10 weekly release for the week of October 19, 2026 (yen per dollar: 158.3600 on Oct 13, 158.8400 on Oct 14, 158.1800 on Oct 15, 158.0000 on Oct 16, 2026; noon buying rates in New York City).
- Federal Reserve Bank of St. Louis (FRED), Japanese Yen to U.S. Dollar Exchange Rate (DEXJPUS), sourced from the Board of Governors of the Federal Reserve System; daily series from January 4, 1971 (357.73) to October 2026.
- Board of Governors of the Federal Reserve System, Foreign Exchange Rates, G.5 monthly release, September 1, 2026 (yen per dollar monthly averages: June 2026, 160.7700; July 2026, 162.3295; August 2026, 158.8476; August 2025, 147.4786).
- Board of Governors of the Federal Reserve System, Implementation Note issued September 16, 2026: federal funds target range raised to 3-3/4 to 4 percent, effective September 17, 2026.
- Bank of Japan, Foreign Exchange Rates (Daily): published every business day since January 4, 2007; figures based on market participants' information; dollar-yen spot rates at 9:00 and 17:00 JST are the mid rates of the bid and offer rates.
- Bank of Japan, Change in the Guideline for Money Market Operations, September 18, 2026: Policy Board voted 7-2 to encourage the uncollateralized overnight call rate to remain at around 1.25 percent; complementary deposit facility rate 1.25 percent; basic loan rate 1.5 percent.
- International Monetary Fund, Finance & Development, March 2008, "Exchange Rate Regimes: Fix or Float?" (Stone, Anderson, Veyrune): floating exchange rates are mainly market determined; central banks intervene mostly to limit short-term fluctuations; almost all advanced economies have floating regimes, which preserve an independent monetary policy.


