Short answer
- The latest official acceptance rate is 34% for the Class of 2030 (the 2025-26 admissions cycle, announced by W&M in April 2026): 6,001 offers from 17,432 applications.
- For the Class of 2029 (the 2024-25 cycle), the official rate was 37%, based on 16,897 applications. W&M reports the in-state and out-of-state rates as identical: 37% each.
- The 34.1% figure still shown on many aggregator sites is the older Class of 2028 cycle (2023-24, reported through IPEDS). Always match the rate to its cycle.
- Early Decision acceptance rates run about 47-49%, well above Regular Decision at about 33-36%. Early Decision is binding; the Regular Decision deadline is January 5.
- Admitted students for the Class of 2030 posted a middle-50% SAT range of 1420-1520 and ACT of 33-35; 89% of those with a class rank were in the top 10% of their high school class.
- The rate is an outcome of supply and demand in a given cycle, not a verdict on any individual applicant. It says nothing about your own chances, which depend on the strength of your application.
If you have searched for William & Mary’s acceptance rate recently, you have probably seen two different answers: 37% on some pages and 34% on others. Both numbers are real. They describe different admissions cycles, and mixing them up is the single most common mistake people make with this statistic. William & Mary, a public research university in Williamsburg, Virginia, founded in 1693 and the second-oldest institution of higher education in the United States after Harvard, published its most recent official figures in April 2026: for the Class of 2030, the university made 6,001 offers of admission from a pool of 17,432 applicants, an admission rate of about 34%. This article puts that number in its full context: the trends over the last decade, the very different Early Decision and Regular Decision rates, the unusual in-state versus out-of-state picture at this public university, and what admitted students’ grades and test scores actually look like. Every figure below is date-stamped to its admissions cycle, because an acceptance rate without a cycle attached is just a rumor with a percentage sign.
Why You See Two Different Acceptance Rates
The confusion has a specific cause. William & Mary labels its admissions data by entering class (Class of 2029, Class of 2030), while federal reporting and many data aggregators label by academic year, and news sites label by the calendar year of the announcement. Three different numbers for three different cycles get quoted side by side, all under the phrase “William & Mary acceptance rate”:
- 34% (Class of 2030): the most recent cycle, the 2025-26 admissions season for students entering in fall 2026. Reported by William & Mary’s own news office on April 8, 2026: 17,432 applicants, 6,001 offers. This is the figure to use now.
- 37% (Class of 2029): the 2024-25 cycle, for students who entered in fall 2025. Reported on W&M’s official undergraduate admission “Facts & Figures” page: 16,897 total applications, 1,642 enrolling students, and 37% overall, in-state, and out-of-state.
- 34.1% (Class of 2028): the 2023-24 cycle, for students who entered in fall 2024. This is the figure carried by College Board’s BigFuture tool (34.07%, from 17,798 applicants and 6,064 admitted) and by CollegeSimply, both citing the IPEDS 2025 survey. It is correct for its cycle and outdated for anyone applying now.
Whenever a page quotes a William & Mary acceptance rate, check which cycle it names. If it names no cycle at all, treat the number as unverified. This article follows W&M’s own convention throughout: figures are tagged by entering class, and each class is tied to its admissions cycle on first mention.
A Decade of William & Mary Selectivity
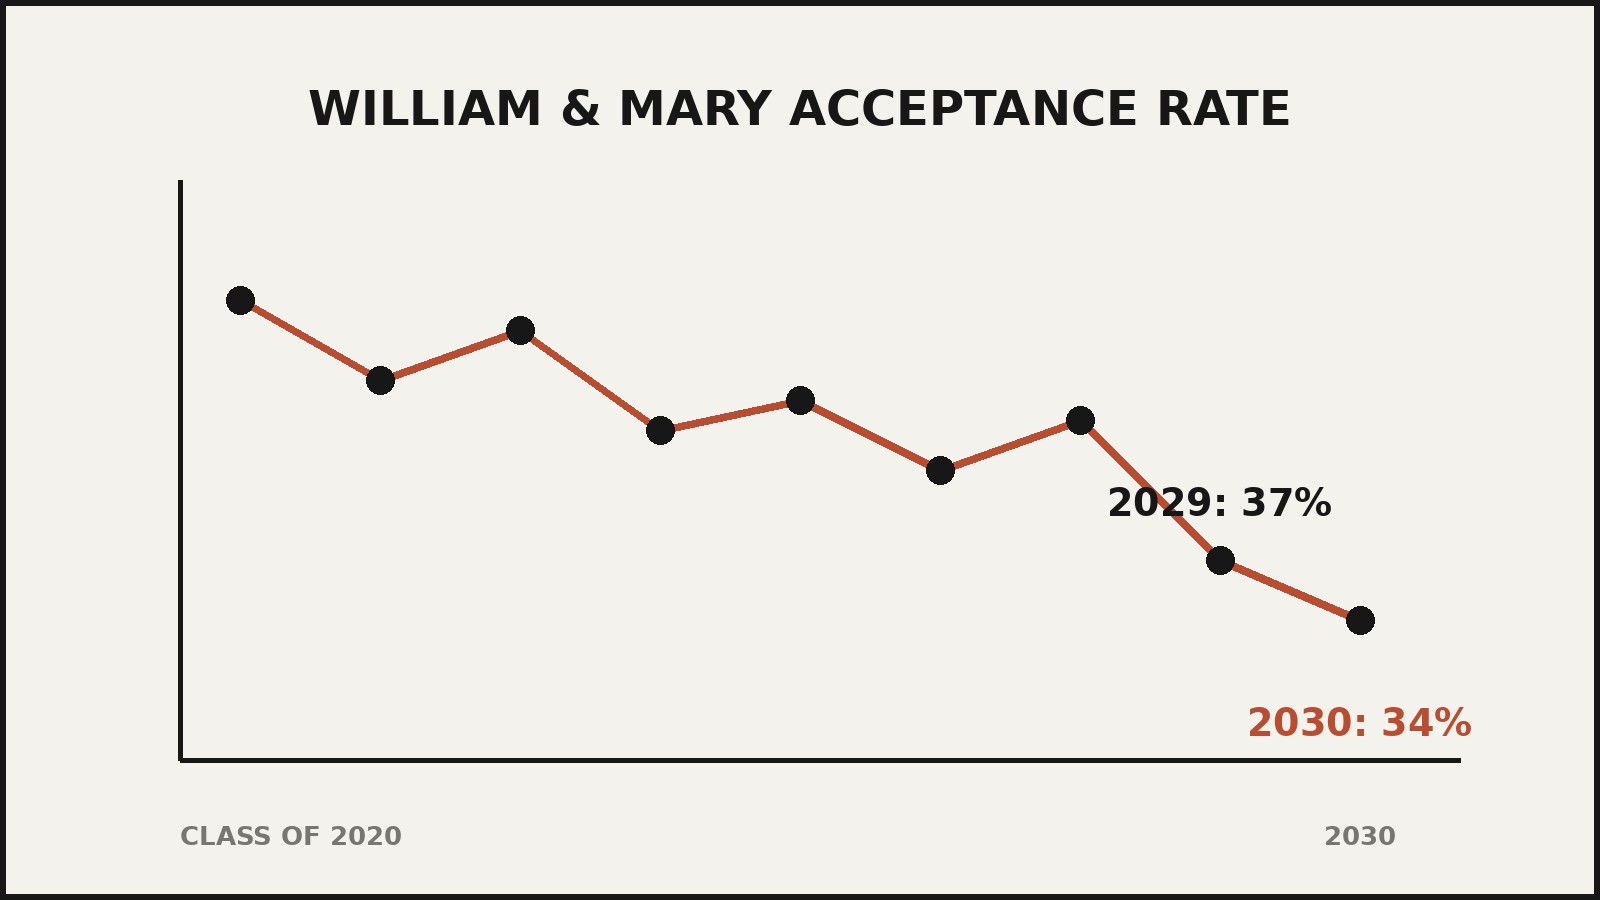
Over the last ten admissions cycles, William & Mary’s acceptance rate has stayed within a relatively narrow band, mostly between 33% and 37%, with one pandemic-era outlier. The table below compiles class-by-class figures; the Class of 2021 through Class of 2029 rows are drawn from William & Mary’s Common Data Set filings, and the Class of 2030 row from W&M’s official April 2026 announcement.
| Entering class | Applicants | Admitted | Acceptance rate |
|---|---|---|---|
| Class of 2020 | 14,382 | 5,253 | 36.52% |
| Class of 2021 | 14,921 | 5,359 | 35.92% |
| Class of 2022 | 14,644 | 5,406 | 36.92% |
| Class of 2023 | 14,680 | 5,532 | 37.68% |
| Class of 2024 | 14,201 | 5,987 | 42.16% |
| Class of 2025 | 17,475 | 6,386 | 36.54% |
| Class of 2026 | 18,087 | 6,059 | 33.50% |
| Class of 2027 | 17,548 | 5,741 | 32.72% |
| Class of 2028 | 17,798 | 6,064 | 34.07% |
| Class of 2029 | 16,895 | 6,245 | 36.96% |
| Class of 2030 | 17,432 | 6,001 | 34.43% |
Compiled from W&M Common Data Set filings (Classes of 2020-2029) and W&M’s official April 2026 announcement (Class of 2030), via the admissions-data compilations checked for this article. Minor differences of a few applications between W&M’s public facts page and Common Data Set based compilations are normal; they do not change the rate. For the Class of 2029, W&M’s facts page reports 16,897 applications against the compilation’s 16,895.
Three things stand out in the trend. First, applications jumped from roughly 14,000-15,000 per cycle for the Classes of 2021 through 2024 to more than 17,000 in every cycle since the Class of 2025. The jump coincided with William & Mary adopting test-optional admissions beginning with the 2020-21 cycle, which lowered a barrier that had kept some students from applying. Second, the number of admission offers stayed remarkably steady, between about 5,250 and 6,400, across the whole decade. When more people apply for roughly the same number of seats, the acceptance rate drifts downward: from the post-pandemic peak of 42.16% for the Class of 2024 to 34.43% for the Class of 2030. Third, the Class of 2029 stands out as a small reversal: applications dipped from 17,798 to about 16,900 and the rate rose to 37% before falling back to 34% for the Class of 2030 as applications recovered.
Compared with the most selective private universities, whose rates have fallen below 10%, William & Mary’s band of the low-to-mid 30s is stable rather than collapsing. But stability is not the same as ease: one applicant in three being admitted still means two in three are not, and the academic profile of those admitted has stayed consistently strong.
Early Decision vs Regular Decision: Two Very Different Rates
William & Mary runs a two-phase Early Decision process (ED I and ED II) alongside Regular Decision, and the acceptance rates in the two tracks differ substantially. Early Decision is binding: if you are admitted, you agree to attend and withdraw other applications. ED I applications are due November 1, with notification in December; ED II applications are due January 5, with notification in January; Regular Decision applicants are also due January 5 and learn their decisions in March. The university does not offer a non-binding Early Action plan.
The official numbers show a consistent gap:
- Class of 2030 (2025-26 cycle, W&M official): a record 1,606 Early Decision applications (up 9% from the prior year) and a record 760 Early Decision offers, for an Early Decision acceptance rate of about 47%. Subtracting the official ED figures from the official totals implies a Regular Decision acceptance rate of about 33% (5,241 RD offers from 15,826 RD applications).
- Class of 2029 (2024-25 cycle): 1,477 to 1,478 Early Decision applicants (the two figures differ by one between W&M’s facts page and secondary compilations) with 727 admitted, for an Early Decision rate of about 49%. Against the official totals, the implied Regular Decision rate is about 36% (5,518 RD offers from about 15,419 RD applications).
- Class of 2028 (2023-24 cycle, secondary compilations): an Early Decision rate of about 47% against a Regular Decision rate of about 33%.
Why is Early Decision easier? Three honest reasons, none of which is a trick. First, the Early Decision pool is smaller and self-selecting: students who commit to a binding plan tend to be strong, well-prepared applicants who have already decided W&M is their first choice. Second, binding offers give the admissions office certainty: an admitted ED student who enrolls is a guaranteed seat filled, so the office can afford to admit more of them. Third, W&M has been actively building its ED pipeline, setting a record for ED applications in the Class of 2030 cycle, which shows the strategy is deliberate.
None of this means applying Early Decision guarantees anything. The ED rate has hovered in the high 40s for years, and the ED applicant pool is academically strong, so the competition within it is real. What the gap does mean is that the single overall acceptance rate understates how selective Regular Decision is and overstates how selective Early Decision is. If you are comparing your chances across the two plans, compare plan to plan, not plan to overall.
In-State vs Out-of-State: An Unusual Equality
William & Mary is a public university, and public universities usually admit in-state applicants at higher rates than out-of-state applicants, often much higher. W&M’s Class of 2029 figures break that expectation: the official facts page reports an overall acceptance rate of 37%, an in-state acceptance rate of 37%, and an out-of-state acceptance rate of 37%. The three numbers are identical. That equality is the rarest line in W&M’s whole admissions profile, and it is worth pausing on: at most selective public universities, the out-of-state rate runs well below the in-state rate.
For the Class of 2030, W&M had not published an in-state/out-of-state split as of the April 2026 announcement; the only official rate given was the overall 34%. What the announcement did show was the geographic reach of the admitted class: students from all 50 states plus Washington, DC, Puerto Rico, the US Virgin Islands, Guam, and the Northern Mariana Islands, and from 57 countries. After Virginia, the most represented states were New York, New Jersey, Maryland, Massachusetts, Pennsylvania, California, North Carolina, Texas, Connecticut, and Florida.
The university has also been investing in in-state access. In 2022 it announced an initiative to cover tuition and fees for all in-state Pell Grant recipients, and the following year it launched its Commonwealth Impact Partnership Program. In fall 2024, W&M reached its initial goal of having Pell Grant recipients make up at least 20% of its in-state students. For the Class of 2030, the university reported a 3% increase in the number of in-state, first-generation students offered admission and a 5% increase in admitted in-state students who applied using an application fee waiver, a leading indicator of potential Pell Grant eligibility. The application fee itself is $75, with fee waivers available.
What Admitted Students Look Like: GPA and Test Scores
Two official snapshots exist, and they describe different groups, so keep the distinction clear: the Class of 2030 figures describe admitted students, while the Class of 2029 figures describe enrolled students.
Class of 2030 (admitted, W&M official, April 2026):
- Of those with a class rank, 89% were in the top 10% of their high school class.
- Middle-50% SAT: 1420-1520. Middle-50% ACT: 33-35.
Class of 2029 (enrolled, W&M official facts page):
- 79% ranked in the top 10% of their high school class.
- Middle-50% GPA: 4.16-4.51 on a 4.0 weighted scale.
- Middle-50% SAT: 1390-1520, with 710-760 on Reading and Writing and 680-760 on Math.
- Middle-50% ACT composite: 32-34.
The middle-50% range means the middle half of students fell between the two numbers: a quarter scored below the lower number and a quarter scored above the upper number. It is not a cutoff. Students outside the range are admitted every year, and students inside the range are denied every year, because W&M evaluates applications holistically rather than by numbers alone.
Two details deserve emphasis. First, the GPA range above is a weighted GPA on a 4.0 scale, which can exceed 4.0 because of weighting for advanced courses; do not compare it directly to an unweighted 4.0-scale GPA. Second, test scores at W&M now describe only the students who chose to submit them. W&M is completely test-optional, and 40% of the Class of 2029 applied without SAT or ACT scores. A test-optional policy means scores are one optional piece of evidence among many, not a requirement, and the published ranges are drawn only from submitters.
The Waitlist and the Transfer Route
Admission is not only about first-year fall entry. Two smaller pipelines have their own rates, and they are worth knowing about if the first-year numbers discourage you.
For the Class of 2029, William & Mary offered 4,085 applicants a place on the waitlist; 1,901 accepted the invitation to remain under consideration; and 103 were ultimately admitted. That is a waitlist admission rate of about 5.4%, drawn from the Common Data Set filing. Waitlist movement swings sharply from year to year depending on how many admitted students enroll, so a waitlist offer is a genuine second chance with genuinely long odds, not a soft rejection and not a promise.
Transfer admission runs higher than first-year admission. W&M’s facts page reports 963 transfer applications with a 46% acceptance rate and 206 enrolled students (the page does not attach a cycle label to this block, and secondary compilations attribute the same figures to the Fall 2025 Common Data Set filing, where 440 of 963 applicants were admitted, about 45.7%). The page’s second transfer block (with Spring Pathways) shows 291 applications, a 63% acceptance rate, and 123 enrolled. If your first-year application does not work out, a strong year or two elsewhere followed by a transfer application is a statistically kinder path into W&M than reapplying as a first-year student, though it is still competitive.
What the Acceptance Rate Does Not Tell You
An acceptance rate is a useful fact, but it is also a frequently misread one. A few cautions are in order before anyone uses W&M’s 34% as a personal forecast.
It is an output, not a verdict. The rate is the result of two things colliding in one cycle: how many people applied and how many seats the university decided to fill. The number of offers has barely moved in a decade; the rate moved because applications moved. A rising or falling rate says more about applicant behavior than about the university getting “harder” or “easier” in any absolute sense.
It says nothing about the applicant pool’s strength. A 34% rate at a school where most applicants are highly qualified is a very different proposition from 34% at a school with a weak pool. W&M’s pool is strong: the profile ranges above show that admitted students typically sit in the top 10% of their high school classes with test scores in the top few percent nationally. The rate and the profile have to be read together.
It hides the yield. About one in four admitted students actually enrolls: the Class of 2029 saw 1,642 enrolling students against about 6,245 offers, a yield of roughly 26%. A low yield is why the university maintains a waitlist and why Early Decision, which guarantees enrollment, carries a higher admit rate. None of this affects an individual applicant, but it explains institutional behavior that can otherwise look puzzling.
It cannot predict your outcome. The strongest honest statement anyone can make about an individual application is that it will be read holistically and that the numbers above describe the middle of the admitted group, not a threshold. No article, calculator, or counselor can convert a school-wide rate into a personal probability without knowing the application, and even then the honest answer is a range, not a number. Treat anyone promising certainty with skepticism.
Rates also vary sharply between schools: the UW-Madison acceptance rate is worked out the same way, from a different applicant pool.
Frequently Asked Questions
What is William & Mary’s acceptance rate right now?
The latest official figure is 34% for the Class of 2030, the students who applied in the 2025-26 cycle and entered in fall 2026: 6,001 offers from 17,432 applications, announced by W&M in April 2026. The prior cycle, the Class of 2029, was 37%.
Is William & Mary hard to get into?
It is selective. An acceptance rate in the mid-30s means roughly two of every three applicants are not admitted, and the admitted group is academically strong: for the Class of 2030, the middle-50% SAT range was 1420-1520 and 89% of those with a class rank were in the top 10%. It is less selective than the most competitive private universities, whose rates sit below 10%, but it is not a safety school for strong students.
What is the acceptance rate for in-state vs out-of-state students?
For the Class of 2029, W&M reported 37% for both in-state and out-of-state applicants, identical to the overall 37%. That equality is unusual for a public university. No official in-state/out-of-state split had been published for the Class of 2030 as of the April 2026 announcement.
What is the Early Decision acceptance rate at William & Mary?
About 47% for the Class of 2030 (760 offers from 1,606 applications) and about 49% for the Class of 2029 (727 admitted from about 1,477 applicants). Early Decision is binding: admitted students agree to attend. W&M offers ED I (November 1 deadline) and ED II (January 5 deadline); it does not offer Early Action.
What is the Regular Decision acceptance rate?
W&M does not publish this figure separately, but it can be derived from the official totals. For the Class of 2030, subtracting the ED figures from the overall figures implies about 33% (5,241 RD offers from 15,826 RD applications); for the Class of 2029, about 36%. These are arithmetic derivations from official totals, not W&M-published rates.
What GPA do you need to get into William & Mary?
There is no required GPA. The middle-50% weighted GPA of enrolled Class of 2029 students was 4.16-4.51 on a 4.0 scale, and 79% ranked in the top 10% of their high school class. Treat these as descriptions of the admitted middle, not cutoffs.
What SAT or ACT scores do you need?
There is no required score, and W&M is completely test-optional. Among Class of 2030 admitted students who submitted scores, the middle-50% SAT was 1420-1520 and the ACT was 33-35. For enrolled Class of 2029 students, the middle-50% SAT was 1390-1520 and the ACT was 32-34. Forty percent of the Class of 2029 applied without submitting scores at all.
Is William & Mary test-optional?
Yes. W&M describes itself as completely test-optional, and 40% of the Class of 2029 applied test-optional. Test-optional admissions began with the 2020-21 cycle. If you submit scores, they are considered; if you do not, you are not penalized.
When is the application deadline?
Regular Decision applications are due January 5. Early Decision I is due November 1; Early Decision II is due January 5. The application fee is $75, with waivers available. Confirm dates on W&M’s admission site before applying, since deadlines can change.
What was William & Mary’s acceptance rate in previous years?
Class of 2028: about 34% (17,798 applicants, 6,064 admitted). Class of 2027: about 33% (17,548 applicants, 5,741 admitted). Class of 2026: about 34% (18,087 applicants, 6,059 admitted). Class of 2025: about 37% (17,475 applicants, 6,386 admitted). Class of 2024: about 42% (14,201 applicants, 5,987 admitted), the pandemic-era high.
What is the transfer acceptance rate at William & Mary?
W&M’s facts page reports 963 transfer applications with a 46% acceptance rate and 206 enrolled students (secondary compilations attribute these to the Fall 2025 Common Data Set: 440 admitted of 963). The page’s second transfer block (with Spring Pathways) shows 291 applications and a 63% acceptance rate.
Not every learner follows the school-to-university path: the Philippines’ Alternative Learning System offers a second route to basic education for out-of-school learners.
Keep reading: How to Write a Personal Statement, With Resume and Cover Letter Tips
Sources & references
- William & Mary Undergraduate Admission, "Facts & Figures" (wm.edu/admission): Class of 2029 figures read directly from the official page on 24 Oct 2026; 16,897 total applications; 1,478 Early Decision applicants; 1,642 enrolling students including 42 in the St Andrews Joint Degree Program; 37% overall, in-state, and out-of-state acceptance rates; enrolled profile (79% top 10% class rank; GPA 4.16-4.51 weighted; SAT 1390-1520, Reading/Writing 710-760, Math 680-760; ACT 32-34); 40% applied test-optional; transfer figures (963 applications, 46% acceptance, 206 enrolled).
- William & Mary News, "William & Mary welcomes admitted Class of 2030 to campus" (news.wm.edu, 8 Apr 2026): 6,001 offers from 17,432 applicants, 34% admission rate; record 1,606 Early Decision applications (up 9%); record 760 Early Decision offers across ED I and II; admitted profile (89% of those with rank in top 10%; SAT 1420-1520; ACT 33-35); geography (50 states plus DC, Puerto Rico, US Virgin Islands, Guam, Northern Mariana Islands; 57 countries; top states after Virginia); in-state first-generation and fee-waiver increases; 2022 Pell Grant tuition initiative; Commonwealth Impact Partnership Program; fall 2024 Pell goal of 20% of in-state students reached; Tim Wolfe (associate provost for enrollment and dean of admission) quote; two-phase ED plus RD process with December/January and March notifications.
- William & Mary Office of Institutional Research, Common Data Set pages (wm.edu/offices/ir): 2025-26 CDS section listing and Section C (First-time, First-Year Admissions) reporting definitions read 24 Oct 2026; CDS archive confirms annual filings back to 1997-98.
- College Board BigFuture, "College of William and Mary Admissions": 34.07% acceptance rate; 17,798 applicants, 6,064 admitted, 1,614 enrolled; Regular Decision deadline January 5; Early Decision deadline November 1; $75 application fee; Common Application; ED binding commitment statement.
- CollegeSimply, "William & Mary Admission Overview" (citing IPEDS 2025 survey for academic year 2024/2025): 34.1%; 6,064 of 17,798 admitted; enrolled testers typically SAT 1400-1530 / ACT 32-34; test-optional; 27% of admitted chose to enroll.
- CollegeVine, "How to Get Into William & Mary" and "What is William & Mary Known For?": Class of 2029 figures (16,895 applications, 6,245 admitted, 37% overall; 1,477 ED applications, 727 admitted, 49% ED; 37% in-state and out-of-state); profile (SAT 1390-1520, ACT 32-34); ED I/ED II deadlines November 1 and January 5; founded 1693, second-oldest institution of higher education in the US after Harvard; "Public Ivies" (Richard Moll, 1985); alumni include four US presidents.
- AdmissionSight, "William & Mary Acceptance Rate: Class of 2030 Admissions Statistics": class-by-class table Classes of 2020-2030 (applicants, admitted, rate) compiled from the Common Data Set with Class of 2030 from official announcements; Class of 2029 waitlist figures (4,085 offered, 1,901 accepted spot, 103 admitted, about 5.4%) and Fall 2025 transfer figures (963 applicants, 440 admitted, 45.69%) attributed to the 2025-26 Common Data Set; test-optional adoption from the 2020-21 cycle.
- CollegeTuitionCompare, "W&M Acceptance Rate Trends": IPEDS-based acceptance-rate trend table (2015-16 through 2024-25) and gender split for the 2024-25 reporting year (men 37.36%, women 32.08%); yield trend (26.62% for 2024-25).
- Acceptancerate.com, "William & Mary Acceptance Rate & Admissions 2026": 37% headline figure (16,897 applications, 6,245 offers, 1,642 enrolled); IPEDS 34.1% key-stat box; acceptance-rate-over-time table 2018-2024.


